
Graphical Representation of Cumulative Frequency Distribution
Graphical Representation of Cumulative Frequency Distribution: Overview
This Topic covers sub-topics such as Ogive: Cumulative Frequency Curve, Cumulative Frequency Curve of Less than Type, Cumulative Frequency Distribution of the More than Type and, Cumulative Frequency Curve of More than Type
Important Questions on Graphical Representation of Cumulative Frequency Distribution
Draw more than ogive for the following distributions. Find the median from the curve.
| Class | Frequency |
Draw a 'less than ogive' for the given frequency distribution:
| Marks | |||||
| No. of students |
Convert a more than cumulative frequency distribution table for the given data :
| Class interval | ||||||
| Frequency |
Convert the following more than type table into simple frequency and find mean.
| Marks | More than | More than | More than | More than | More than |
| No. of students |
Convert the following less than type table into simple frequency and find mean.
| Marks | Less than | Less than | Less than | Less than | Less than |
| No. of students |
Form a less than cumulative frequency table.
| Frequency |
To draw “Less than” ogive we take ___ on axis:
From following table, what is the cumulative frequency of less than type for the class ?
| Class | |||||
| Frequency |
| Distance covered per litre () |
||||
| Number of cars |
The median of the distances covered per litre shown in the above data is in the group
Which one of the following more than type O-give is correct for the below-given data?
| Class Interval | Frequency () |
Which of the statements is correct for Ogive given below?
Which one of the following less than type Ogive is correct for the below-given data?
| Class Interval | Frequency () |
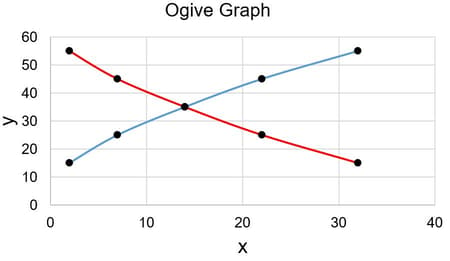
Which of the following statements is correct regarding the cumulative frequency curve of less than type and more than type?
Find the value of mean and mode for the data given below.
| Class interval | |||||
| Frequency |
Assume the maximum value of the class interval is .
Find the value of and then find mean and mode for the data given below.
| Marks obtained: | |||||
| Number of students |
The total number of student appeared in the exam is .
Assume the maximum marks obtained is .
Find the mean and mode for the data given below.
| Class interval | |||||
| Frequency |
Assume the minimum value for the class interval is .
Find the mean and mode for the data given below.
| Marks obtained: | |||||
| Number of students |
Assume the minimum marks obtained is .
Find the mean and mode for the data given below.
| Marks obtained: | |||||
| Number of students |
Assume the minimum marks obtained is .
The heights of girls of Class of a school are recorded as follows.
A 'more than type' ogive for the above data is
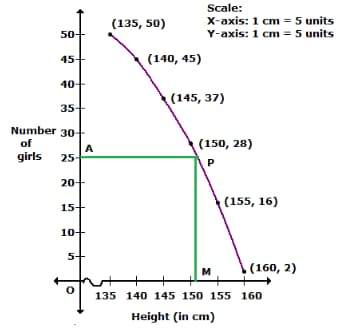
The median is
The heights of students are measured. The results have been used to draw this cumulative frequency diagram. 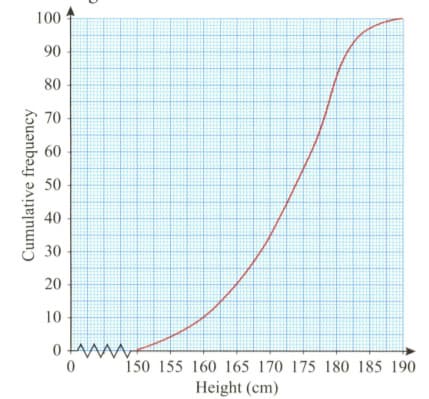
Find the number of students with a height greater than .


